The time has come… Yes, that time of year when once again I get to share my insights into the 2017 Internet Trends Report!
Each year, Mary Meeker of Kleiner, Perkins, Caulfield & Byers (KPCB) presents the Internet Trends Report, highlighting all the data they have gathered about consumers, digital marketers, advertisers and brands during the prior year. This year’s 355-page slide deck meets all of our expectations, and more. When you get time, you really should start going through it slide-by-slide.
The #QueenofLocalSEO’s Take on the 2017 Internet Trends Report
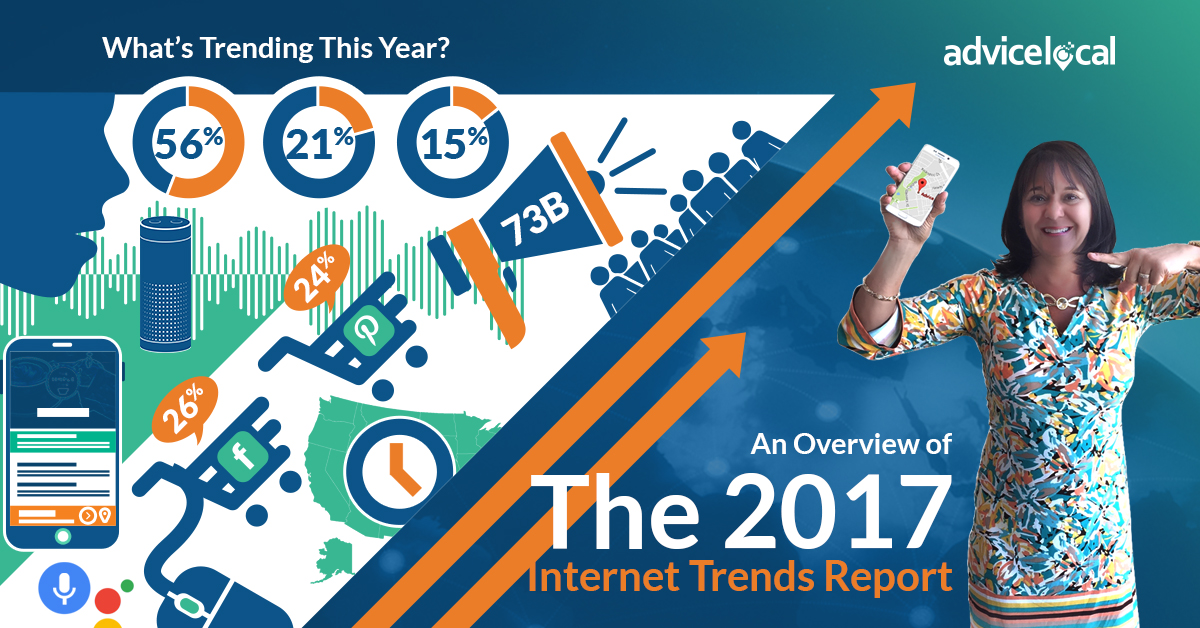
Today I’m going to break down the 11 trends that stuck out the most – and a bonus #12. The below images are excerpts from our full 2017 Internet Trends Report Infographic that’s available for embed and sharing with your clients and friends. Let’s Get Started…
1. USA Internet Usage Grows Each Year
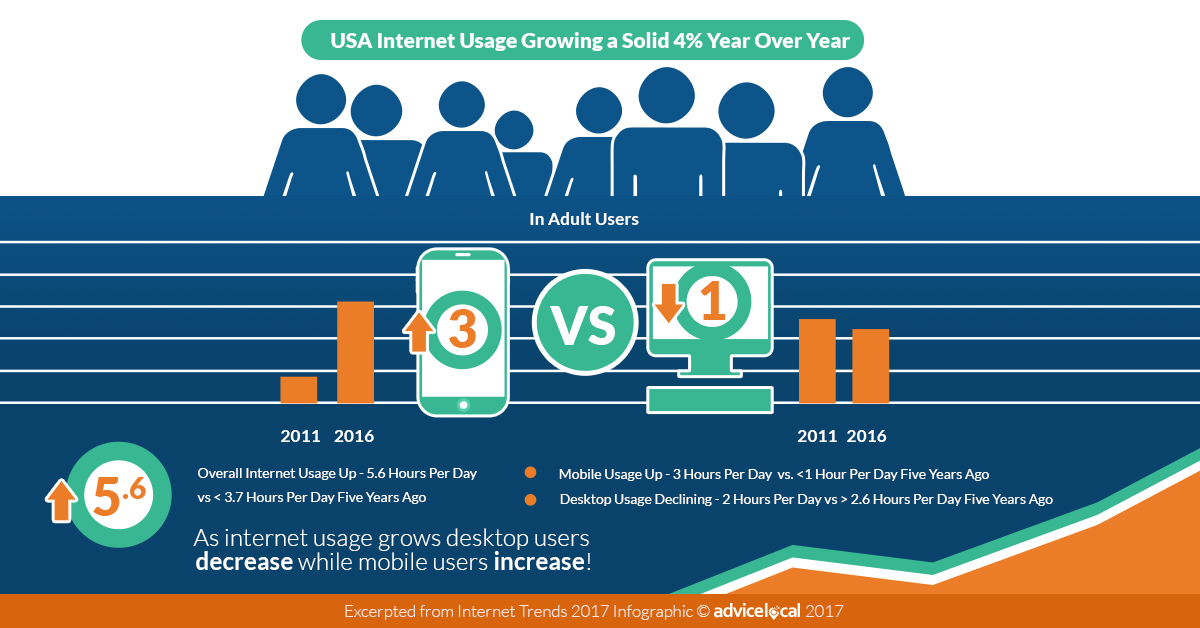
Are you really surprised that internet usage in the USA is up? The only thing that surprised me here is the fact that usage is up only by 4%. I’m on the internet pretty much 24/7, and so is my team. I imagine this is the same for a lot of companies around the United States.
A fact that really hit home for me is that desktop usage is declining by the minute, as mobile usage keeps increasing. Definitely, more of us are on the internet and we all seem to have smartphones!
2. Advertising Spend Increases as Mobile Usage Increases
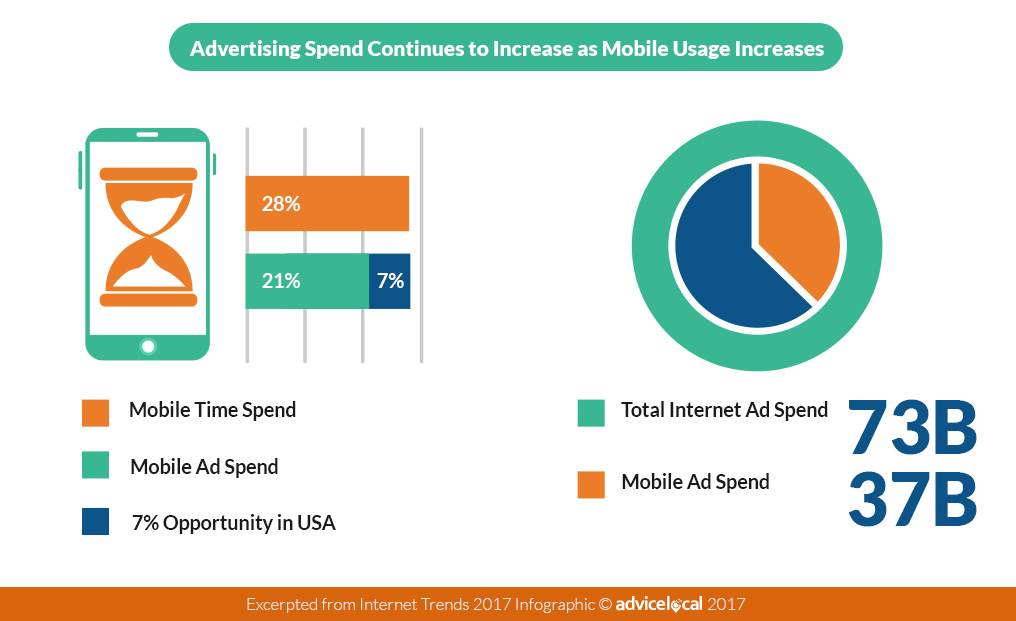
Of course, with mobile usage increasing we are definitely going to see an increase in mobile advertising spend. Surprisingly, it’s reported that $73B is spent on Internet Advertising with only $37B of that total being spent on mobile. Does it seem like something’s wrong with this picture?
In the USA alone there is a definite gap in the amount of time spent on mobile compared to the mobile ad spend – a 7% gap that advertisers should be taking advantage of. Are you leveraging mobile advertising yet? Maybe you need to put this into your next quarter’s planning.
3. Google and Facebook Dominate Internet Advertising Growth
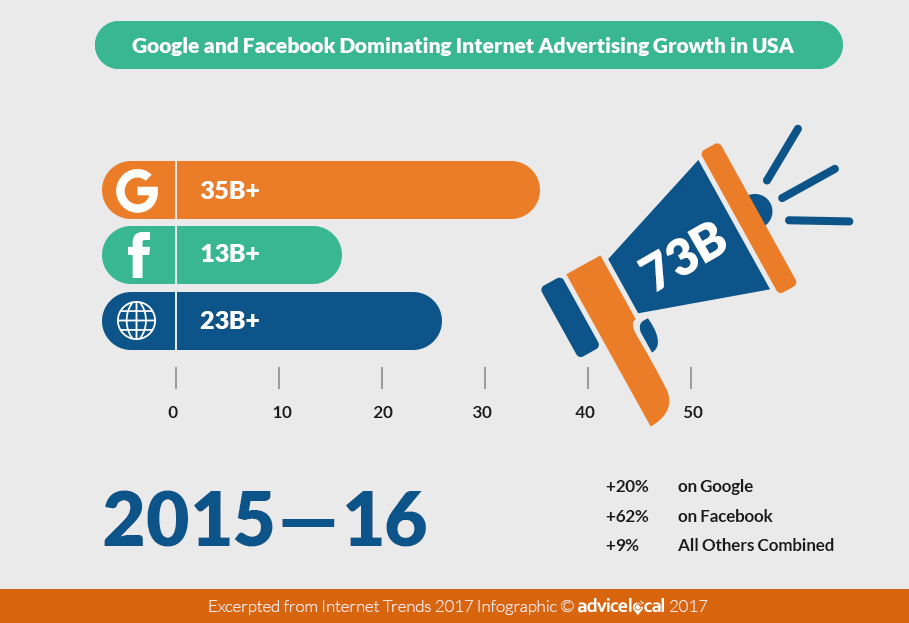
Right now Google and Facebook are dominating internet advertising growth. Brands and businesses seem to be spending the most money with them. In fact, of the $73B mentioned above, it appears Facebook is getting $13B of those dollars while Google is getting $35B.
From 2015 to 2016, Facebook advertising has increased a whopping 62%, Google 20%, and all others combined have increased 9%. Perhaps this explains why Twitter, Pinterest, and the other platforms are continually trying to fine-tune their advertising options.
4. Facebook and Pinterest Advertising are Driving Sales
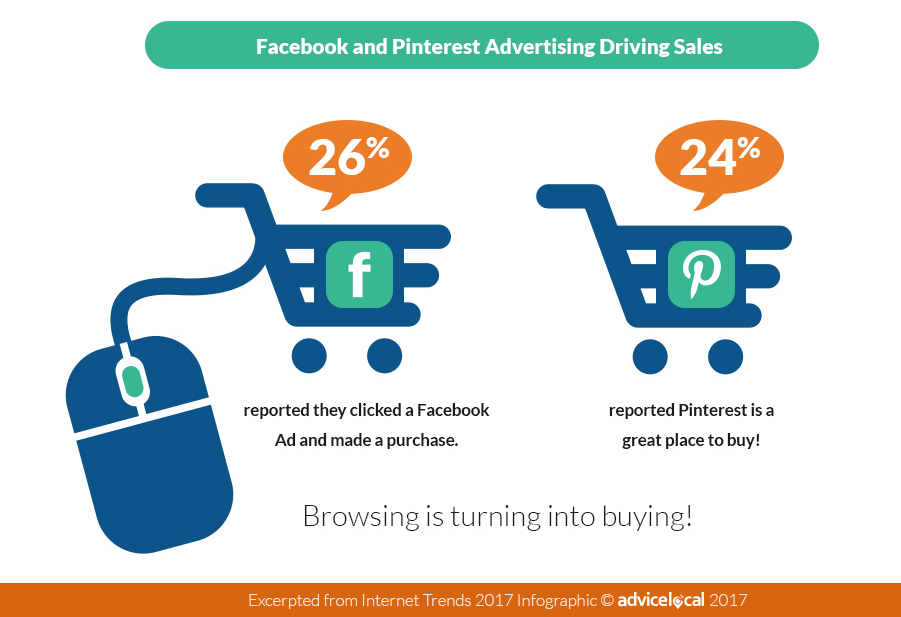
While Google is getting $35B in advertising dollars, it looks like Facebook and Pinterest are actually getting the most sales. Of consumers surveyed, 26% reported that if they clicked a Facebook Ad, they followed through to make a purchase. On that same survey, 24% reported that Pinterest is a great place to browse and buy!
We have more and more clients shifting a portion of their advertising budget to Facebook ads, when it makes the most sense for their product. This allows them to stretch their ad dollars farther and reach consumers where they like to visit.
5. Social Media Advertisers Like Measurable Metrics
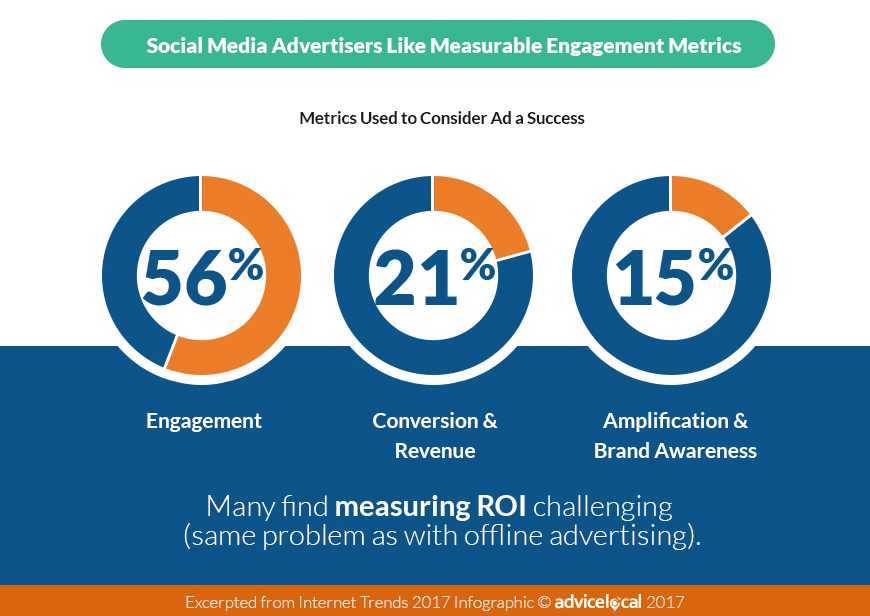
Tracking social media ROI is the same elusive target it has always been. Just as with offline advertising, measuring is one of the biggest challenges, and many advertisers have shifted the metrics of what they consider a success. In fact, 56% consider the ad a success if they get engagement. Of those surveyed, 21% are still looking to the conversion to measure success. And surprisingly, 15% reported that if they see amplification, they’re happy.
I didn’t take this survey, but if I had, my priority would be conversion first (like a download, a demo requested, or an opt-in) and engagement second. With engagement comes amplification, so I wouldn’t consider it as much a metric as a positive side-effect.
6. Marketers Still Find Social Media Marketing a Challenge
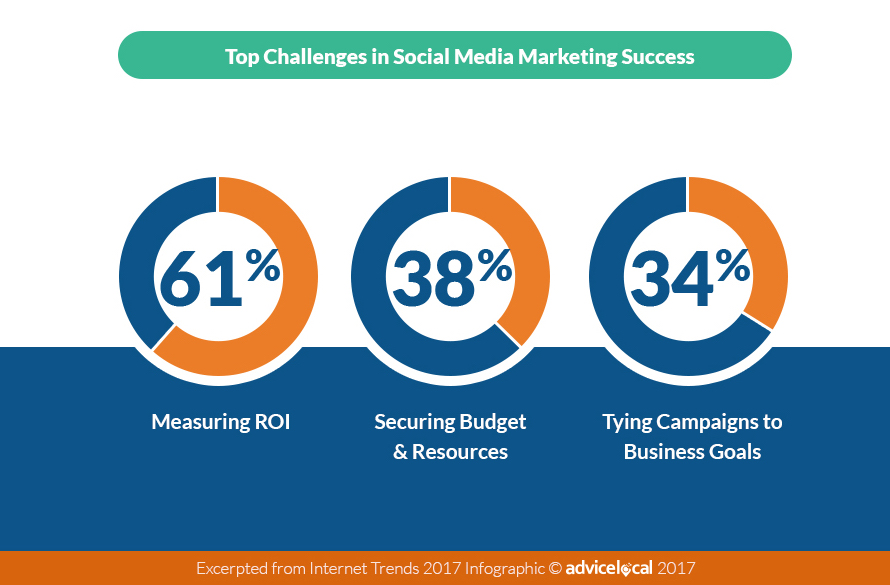
As mentioned above, social media ROI is a big issue. In fact, 61% reported that their biggest challenge is measuring ROI. For others in some cases, it’s getting the big boss (or the CFO) to approve the social media advertising budget, with 34% reporting they struggle with connecting social media campaigns to business goals. And that’s probably the reason why they do not get that budget approval from the higher-ups.
7. Consumers Want Better Customer Service
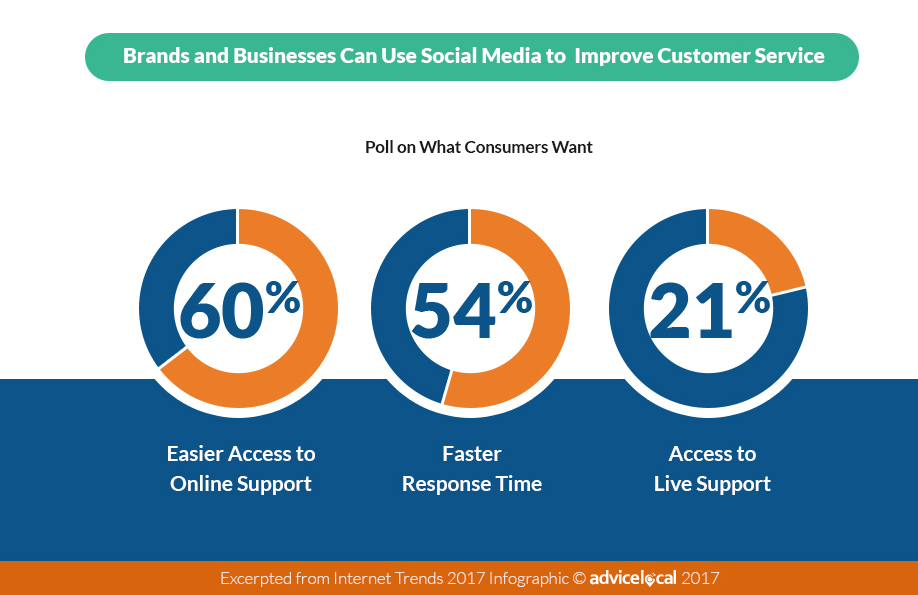
With advertisers shifting their dollars to social media, consumers want and expect to get better online support. Mary Meeker reported that social media could help deliver that.
Here’s an example. Because 60% of consumers want easier access to online support, Facebook’s chat feature could be the answer. But hold on, because social media might not be the only solution.
Google has a messaging feature that a local business can turn on within the Google Business Profile (formerly Google My Business) dashboard. When this feature is turned on, the consumer can send a text message to the business, and they can respond via text. If handled correctly, this means that 24/7 customer service is basically available from Google search results.
8. Google’s Geo-Targeted Local Ads Drive Foot Traffic
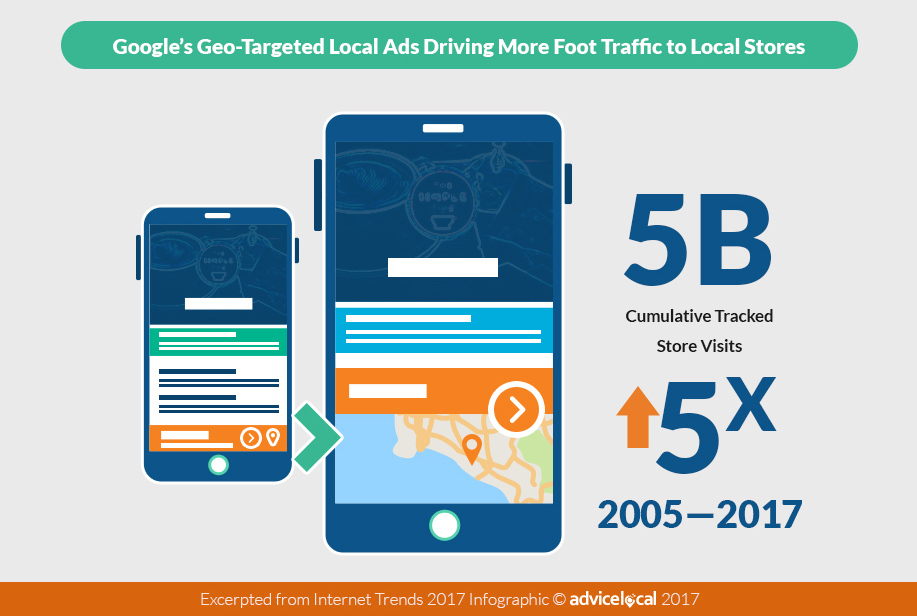
The social media advertising stats above are eye-opening, but it doesn’t mean you should stop looking to Google to spend an advertising budget! In fact, from 2005–2017 the number of Geo-Targeted local ads driving customers right to the door has increased 5x, for a total of 5B cumulative tracked store visits.
What should this tell you? Yes – it’s time to make sure that location data is up-to-date! That Google Business Profile listing will only continue to gain in importance, not drop or decrease.
9. Voice Search is on the Rise
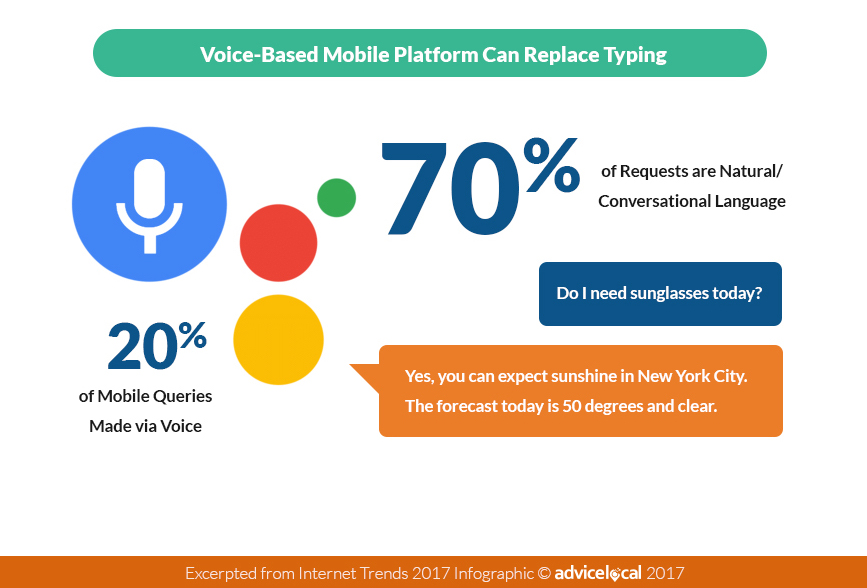
Have you replaced typing with voice on your phone yet? How many requests are you making daily to Siri or Google Now? Trends show that 20% of mobile queries are made via voice.
Consider the content on your website. Is it still stuffed with keywords, or is it conversational with a natural flow? 70% of requests made via voice search are in natural or conversational language. If the content is complicated and feels like it is written by a machine, chances of placement on the first page of search could be bleak.
10. AI is Getting Smarter
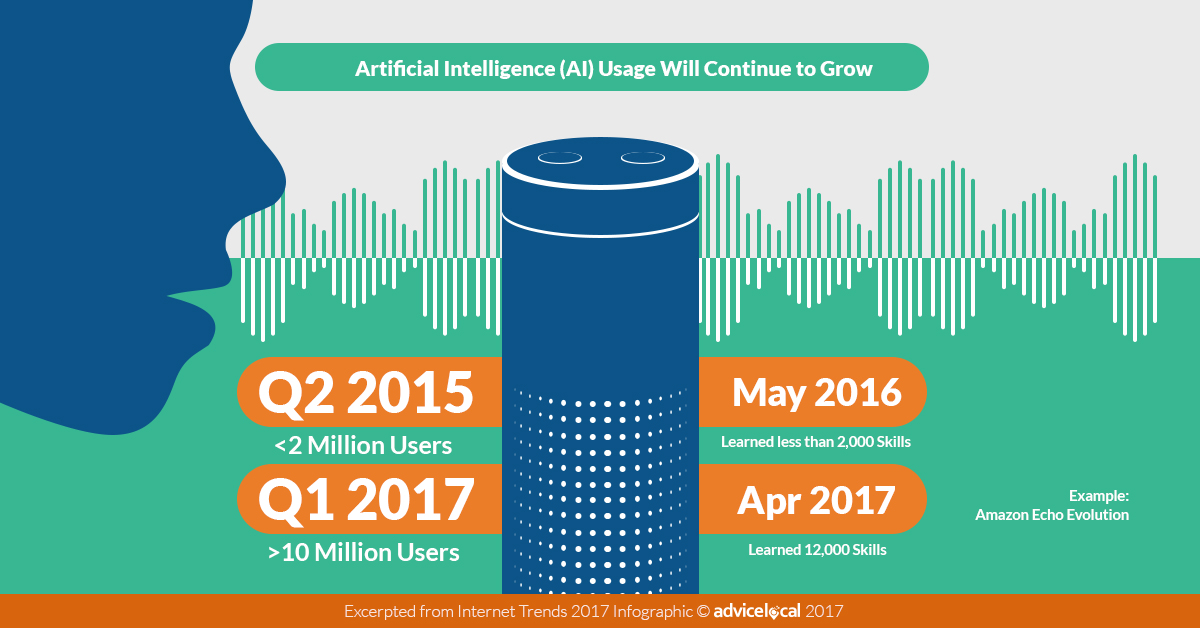
Speaking of machine learning, artificial intelligence (AI) is getting smarter each day. Let’s use Amazon Echo as an example. Their AI has used learned over 12,000 skills as of April 2017. Currently they have over 10 million users, vs. less than 2 million users in 2015.
But I hope you realize Amazon is not the only one using AI. Google’s RankBrain algorithm is a smart AI that returns search results to consumers based on their intent vs. what they actually search for.
11. Mobile Device Time has Doubled in the USA
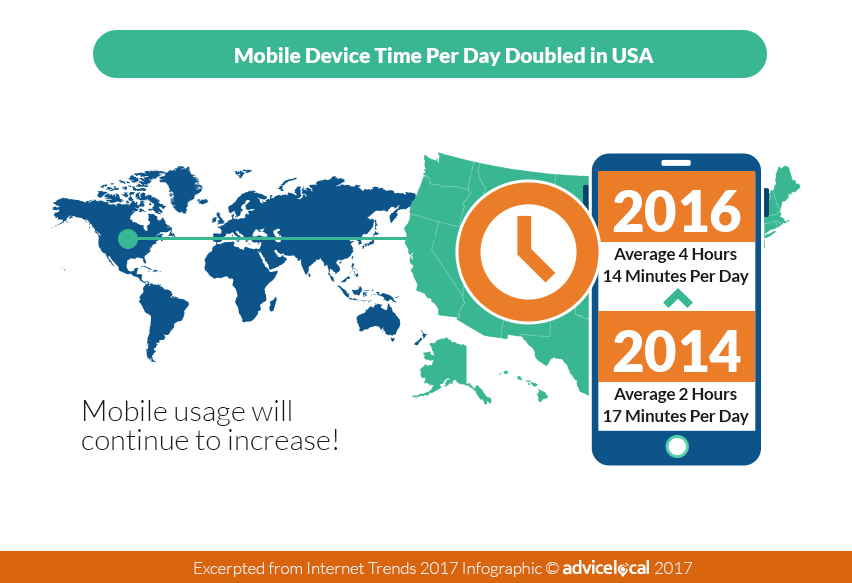
I began by talking about internet usage and mobile vs. desktop, and I want to close by sharing an eye-opening stat! Time being spent on mobile devices has doubled. In 2014 users spent an average of 2 hours,17 minutes per day. Today, mobile device time is topping out at over 4 hours and 14 minutes per day. And mobile usage will only continue to increase!
12. And That’s a Wrap
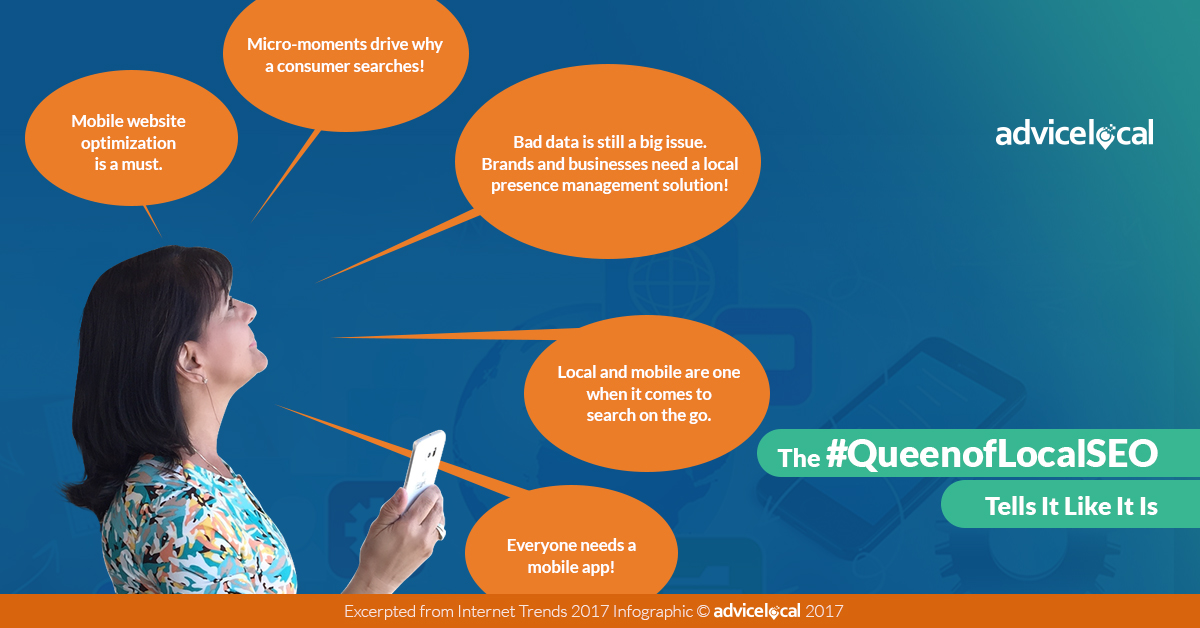
I’m known for telling it like it is, and today I want to tell you that local, mobile and social are more important than ever before. From advertising to mobile optimization and directory listings, businesses and brands that fail to meet the consumer on their own terms will be left behind!
It’s Time to Take Action
Have you noticed the new products we are rolling out to help meet these consumer needs? From reputation management and a branded mobile app solution, to our location landing page technology, we have you covered! Learn about our partner solutions today.


2 thoughts on “What’s Trending? Must-Know Data Points from the 2017 Internet Trends Report”
Comments are closed.